Business Performance and Financial Status
-
Net Sales
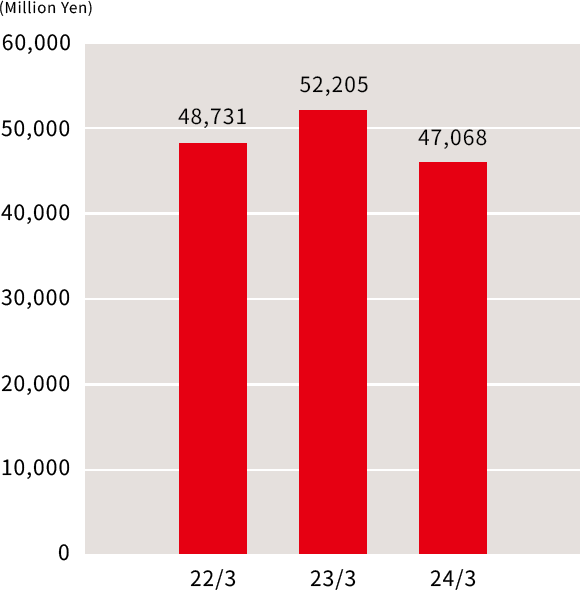
22/3 23/3 24/3 Net Sales
(Million Yen)48,731 52,205 47,068 -
Operating Profit
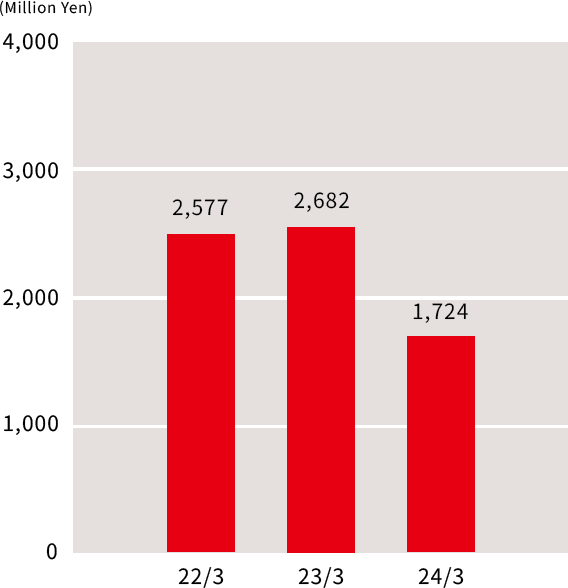
22/3 23/3 24/3 Net Sales
(Million Yen)2,577 2,682 1,724 Percentage of Net Sales
(%)5.3 5.1 3.7 -
Ordinary Profit
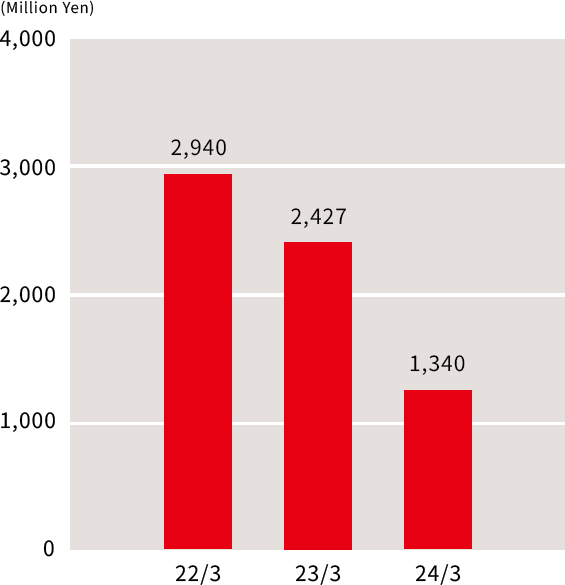
22/3 23/3 24/3 Ordinary Profit
(Million Yen)2,940 2,427 1,340 Percentage of Net Sales
(%)6.0 4.7 2.8 -
Current Net Profit Attributable to Owners of the Parent
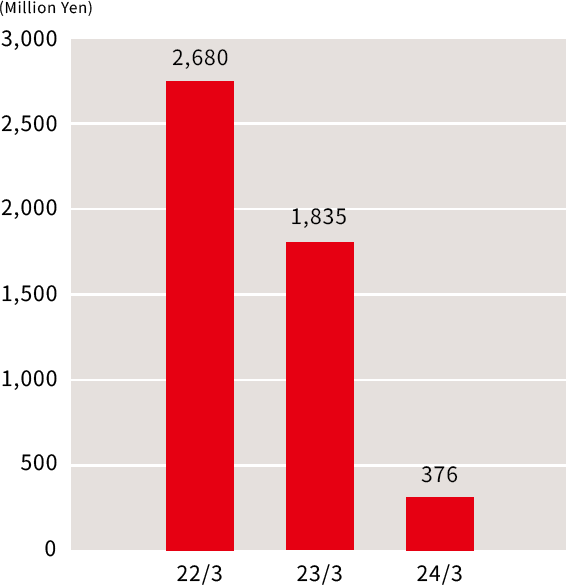
22/3 23/3 24/3 Current Net Profit
(Million Yen)2,680 1,835 376 Percentage of Net Sales
(%)5.5 3.5 0.8 -
Return of Equity
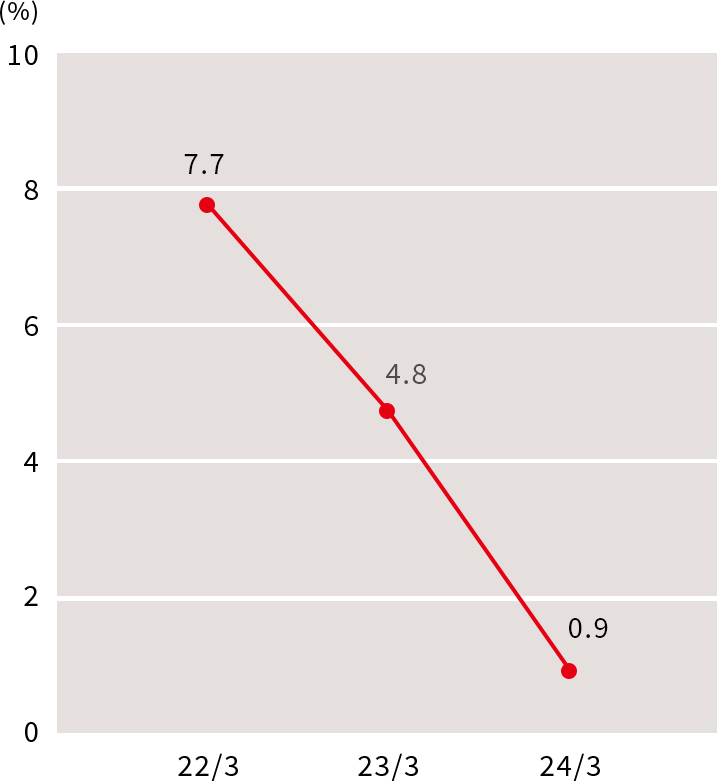
22/3 23/3 24/3 Net Profit Margin
(%)7.7 4.8 0.9 -
Operating Profit on Sales
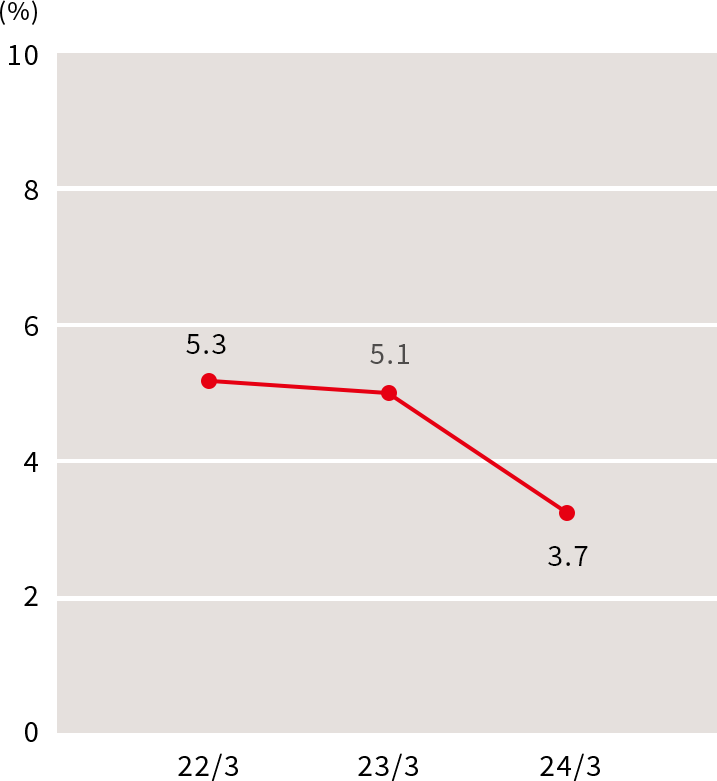
22/3 23/3 24/3 Operating Profit Margin
(%)5.3 5.1 3.7
Consolidated Balance Sheet
| As of March 31, 2022 |
As of March 31, 2023 |
As of March 31, 2024 |
|
|---|---|---|---|
| Current Assets | 50,834 | 57,941 | 62,192 |
| Fixed Assets | 18,018 | 19,703 | 24,447 |
| Total Assets | 68,852 | 77,645 | 86,639 |
| Current Liabilities | 22,489 | 26,229 | 30,862 |
| Fixed Liabilities | 9,424 | 11,752 | 15,498 |
| Total Liabilities | 31,913 | 37,981 | 46,360 |
| Shareholders' Equity | 35,102 | 36,215 | 35,532 |
| Accumulated Other Comprehensive Income | 1,835 | 3,446 | 4,746 |
| Total Net Assets | 36,938 | 39,663 | 40,278 |
| Total Liabilities and Net Assets | 68,852 | 77,645 | 86,639 |
Consolidated Statements of Cash Flows
| As of March 31, 2022 | As of March 31, 2023 | As of March 31, 2024 | |
|---|---|---|---|
| Cash Flows from Operating Activities | 1,619 | -4,155 | -8,222 |
| Cash Flows from Investing Activities | -777 | -1,572 | -4,244 |
| Cash Flows from Financing Activities | -4,238 | 6,127 | 9,268 |
| Cash and Cash Equivalents at End of Period | 10,601 | 11,301 | 8,454 |